How Much TV Advertising Ran Across Bangladesh in August?
AUGUST 2026 · ON-AIR MONITORING REPORT
TV Commercial Duration Across Bangladeshi Television
A detailed analysis of commercial airtime across 40 monitored channels, day by day, for the month of August 2026.
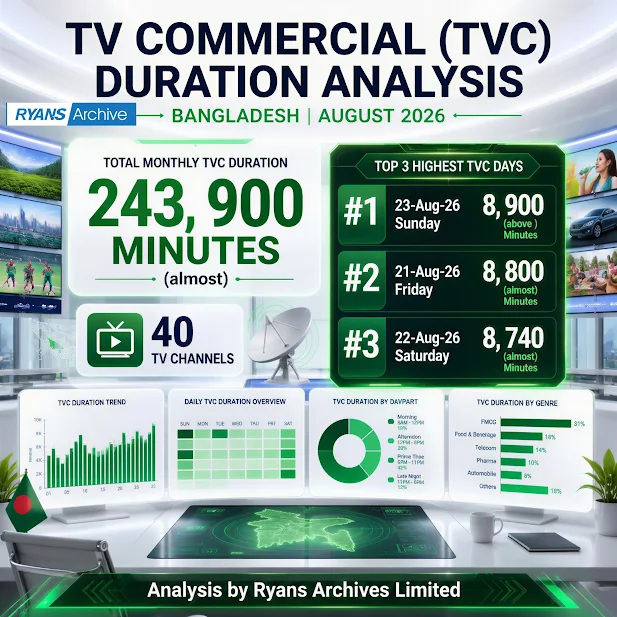
In August 2026, forty Bangladeshi television channels carried a combined 243,876 minutes of commercial content — an average of 196.7 minutes, or roughly three hours and seventeen minutes, of advertising per channel every day. Behind that headline figure lies a clear and fairly steady pattern: commercial volume was not flat across the month. It built from week to week, accelerated sharply in the back half of August, peaked around a specific five-day stretch, and consistently favoured certain days of the week over others. This report walks through that pattern in detail, using the complete daily dataset, a week-by-week trajectory, and a breakdown by day of the week.
The table below collects the headline numbers referenced throughout this report, for quick reference.
| Metric | Value | Context |
|---|---|---|
| Total monthly TVC duration | 243,876 min | 40 channels, 31 days |
| Average per channel, per day | 196.7 min | ~3h 17m daily |
| Highest single day | 8,906 min | Sun, 23 Aug |
| Lowest single day | 6,980 min | Sat, 1 Aug |
| Busiest weekday (by average) | Friday — 8,053 min | Across all 4 Fridays |
| Quietest weekday (by average) | Tuesday — 7,627 min | Across all 4 Tuesdays |
Rather than fluctuating randomly, commercial duration rose in a fairly consistent staircase across August. Each successive week ran heavier than the one before it, with the increase accelerating as the month went on — the jump from Week 3 to Week 4 (+8.7%) was more than three times larger than the jump from Week 1 to Week 2 (+2.4%). By the fourth week, the daily average had climbed to 8,541 minutes, some 1,200 minutes — over 16% — above where the month started.
| Period | Total TVC (min) | Daily average | Change vs. prior week |
|---|---|---|---|
| Week 1 · 1–7 Aug | 51,390 | 7,341 | — |
| Week 2 · 8–14 Aug | 52,613 | 7,516 | +2.4% |
| Week 3 · 15–21 Aug | 55,001 | 7,857 | +4.5% |
| Week 4 · 22–28 Aug | 59,790 | 8,541 | +8.7% |
| Remainder · 29–31 Aug | 25,082 | 8,361 | (3-day partial week) |
This staircase pattern is the clearest structural signal in the data: whatever drove the mid-month surge did not arrive as a single spike and fade, but as a sustained shift that held for the rest of the month. Every day from August 20 onward closed above 8,100 minutes, and the month never returned to its opening-week levels.
Averaging each weekday across all four (or five) of its occurrences in August shows a consistent hierarchy, independent of any single unusual day. Friday and Thursday were reliably the two heaviest advertising days, while Tuesday was consistently the lightest — a pattern that held even before the mid-month surge began.
| Weekday | Occurrences | Average TVC (min) | Rank |
|---|---|---|---|
| Friday | 4 | 8,053 | 1st — busiest |
| Thursday | 4 | 8,002 | 2nd |
| Sunday | 5 | 7,890 | 3rd |
| Monday | 5 | 7,846 | 4th |
| Saturday | 5 | 7,835 | 5th |
| Wednesday | 4 | 7,825 | 6th |
| Tuesday | 4 | 7,627 | 7th — quietest |
The gap between the busiest and quietest weekday averages — Friday at 8,053 minutes versus Tuesday at 7,627 minutes — is about 426 minutes, or 5.6%. That is a modest but persistent difference, suggesting Friday's premium is a structural feature of the broadcast week rather than a one-off result of the days that happened to fall on a Friday this particular month.
The three highest-volume days of the month all fell within the same five-day window, between August 20 and August 24. Sunday, August 23 topped the entire month at 8,906 minutes of commercial airtime across all 40 channels, working out to roughly 222.7 minutes per channel on that single day — nearly a full hour more per channel than the monthly average.
| Rank | Date | Day | Total TVC (min) | Avg per channel |
|---|---|---|---|---|
| 1st | 23 Aug 2026 | Sunday | 8,906 | ~222.7 min |
| 2nd | 21 Aug 2026 | Friday | 8,795 | ~219.9 min |
| 3rd | 22 Aug 2026 | Saturday | 8,742 | ~218.6 min |
Friday is a natural high-traffic day for Bangladeshi broadcast advertising, and the week-by-week data bears that out clearly. Commercial duration on Fridays rose for three consecutive weeks, climbing from 7,503 minutes on the first Friday to a peak of 8,795 minutes on the third Friday — a 17.2% increase over the month, and the second-highest single day across all 31 days — before easing slightly to 8,281 minutes on the final Friday, still well above where the month began.
| Date | Week | Total TVC (min) | Remarks |
|---|---|---|---|
| 7 Aug 2026 | 1st Friday | 7,503 | Baseline |
| 14 Aug 2026 | 2nd Friday | 7,632 | +1.7% over 1st Friday |
| 21 Aug 2026 | 3rd Friday | 8,795 | +15.2% over 2nd Friday — 2nd highest day of month |
| 28 Aug 2026 | 4th Friday | 8,281 | -5.8% from 3rd Friday |
The clearest structural shift in the data is the difference between the first and second halves of August. Across August 1–15, channels averaged 7,424 minutes of commercial airtime per day. From August 16–31, that average rose to 8,282 minutes per day — an increase of roughly 11.5%. The surge is concentrated around August 20–24, which stands out as the peak commercial window of the month, anchored by the month's highest day on August 23.
Measured another way, the spread between the single busiest day (8,906 minutes, August 23) and the single quietest day (6,980 minutes, August 1) is 1,926 minutes — a swing of 27.6% from trough to peak. A few further points stand out in the daily record:
● The lowest-volume day of the month was August 1 (a Saturday), with 6,980 minutes — nearly 2,000 minutes below the peak on August 23, and the only day of the month under 7,000 minutes.
● August 20 marks a visible "trend jump": daily duration rose by roughly 780 minutes (about 10%) from the prior day and stayed elevated for the rest of the month, never falling back below 8,100 minutes.
● Every day from August 20 onward recorded above 8,100 minutes, compared with a first-half average closer to 7,400 minutes — the second half of the month never really returned to first-half levels, which is consistent with a genuine shift in advertising demand rather than a brief anomaly.
● Within the peak window, three of the five days (August 21, 22, and 23) rank as the three highest days of the entire month, with August 20 and 24 close behind at 8,668 and 8,686 minutes respectively.
A few practical implications follow from these patterns. First, inventory is measurably tighter on Thursdays and Fridays than on Tuesdays and Wednesdays, so advertisers seeking uncluttered slots — or planners trying to manage viewer fatigue — may find early-week days offer comparatively more breathing room. Second, the sustained second-half surge suggests that competition for viewer attention was structurally higher for roughly half the month, which is useful context when comparing campaign recall or engagement results across different weeks of August. Third, because the surge held steady rather than spiking and receding, any campaign that launched or ran through August 20–24 was competing against the single heaviest commercial window of the month across all 40 channels.
The full day-by-day breakdown behind this analysis is provided below, covering all 31 days of August 2026 across the 40 monitored channels.
| Date | Day | TVC (min) | Notes |
|---|---|---|---|
| 1 Aug 2026 | Saturday | 6,980 | Lowest day of the month |
| 2 Aug 2026 | Sunday | 7,305 | - |
| 3 Aug 2026 | Monday | 7,375 | - |
| 4 Aug 2026 | Tuesday | 7,405 | - |
| 5 Aug 2026 | Wednesday | 7,398 | - |
| 6 Aug 2026 | Thursday | 7,424 | - |
| 7 Aug 2026 | Friday | 7,503 | 1st Friday |
| 8 Aug 2026 | Saturday | 7,654 | - |
| 9 Aug 2026 | Sunday | 7,638 | - |
| 10 Aug 2026 | Monday | 7,334 | - |
| 11 Aug 2026 | Tuesday | 7,416 | - |
| 12 Aug 2026 | Wednesday | 7,433 | - |
| 13 Aug 2026 | Thursday | 7,506 | - |
| 14 Aug 2026 | Friday | 7,632 | 2nd Friday |
| 15 Aug 2026 | Saturday | 7,362 | - |
| 16 Aug 2026 | Sunday | 7,260 | - |
| 17 Aug 2026 | Monday | 7,527 | - |
| 18 Aug 2026 | Tuesday | 7,498 | - |
| 19 Aug 2026 | Wednesday | 7,891 | - |
| 20 Aug 2026 | Thursday | 8,668 | Trend jump |
| 21 Aug 2026 | Friday | 8,795 | 2nd highest overall |
| 22 Aug 2026 | Saturday | 8,742 | 3rd highest overall |
| 23 Aug 2026 | Sunday | 8,906 | Highest day overall |
| 24 Aug 2026 | Monday | 8,686 | - |
| 25 Aug 2026 | Tuesday | 8,189 | - |
| 26 Aug 2026 | Wednesday | 8,576 | - |
| 27 Aug 2026 | Thursday | 8,410 | - |
| 28 Aug 2026 | Friday | 8,281 | 4th Friday |
| 29 Aug 2026 | Saturday | 8,436 | - |
| 30 Aug 2026 | Sunday | 8,340 | - |
| 31 Aug 2026 | Monday | 8,306 | - |
METHODOLOGY
Figures represent total commercial (TVC) airtime logged across 40 monitored Bangladeshi television channels for August 2026. Daily totals are summed across all 40 channels; per-channel averages are the daily total divided by 40. Weekly figures group days into consecutive 7-day blocks starting August 1; day-of-week averages group all occurrences of each weekday across the month (4 occurrences for Tuesday, Wednesday, Thursday, and Friday; 5 for Saturday, Sunday, and Monday).